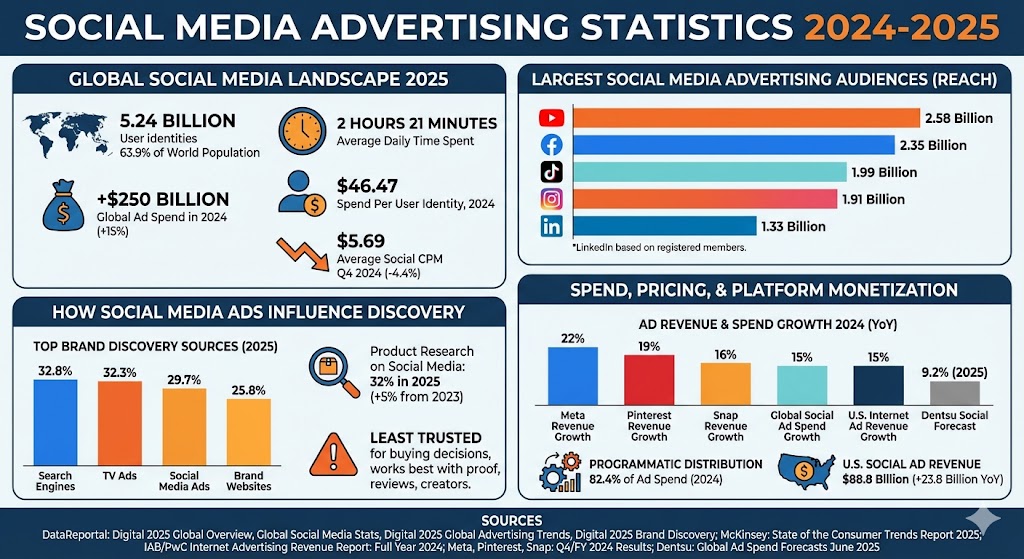
Social media advertising keeps growing because audience scale is still massive, discovery behavior is increasingly multi-channel, and the biggest platforms continue to improve monetization even as CPM pressure shifts quarter to quarter.
Global social media user identities reached 5.24 billion at the start of 2025, equal to 63.9% of the world’s population.
The typical internet user now spends 2 hours and 21 minutes per day on social media.
Global social media ad spend rose 15% in 2024 and reached close to a quarter of a trillion U.S. dollars.
Marketers spent an average of $46.47 per social media user identity to reach social audiences in 2024.
Average social media CPM was $5.69 in Q4 2024, down 4.4% from $5.83 in the 2023 holiday quarter.
Social media ads were cited by 29.7% of connected consumers as a source of brand discovery, and social ads rank as the top discovery source among internet users aged 16 to 34.
Across markets, social media use for product research rose to 32% in 2025, up from 27% in 2023.
U.S. internet advertising revenue hit a record $259 billion in 2024, while U.S. social media advertising revenue rose by $23.8 billion to $88.8 billion.
Programmatic or dynamic distribution accounted for 82.4% of ad spend in 2024.
Dentsu forecasts social ad spend growth of 9.2% in 2025.
Largest social media advertising audiences
Advertising reach remains concentrated at the top. YouTube leads the major platforms by reported ad reach, followed by Facebook, TikTok, Instagram, and LinkedIn.
These platform figures are best read as advertising reach rather than perfectly comparable active-user counts. LinkedIn’s reported 1.33 billion figure is based on registered members, not monthly active users.
How social media ads influence discovery
Social media advertising is now a mainstream discovery channel rather than a niche add-on. Globally, nearly three in ten consumers say social ads help them discover brands, and among internet users aged 16 to 34, social media ads rank ahead of every other discovery source.
Label
Bar
Value
Search engines
32.8%
TV ads
32.3%
Social media ads
29.7%
Brand websites
25.8%
Max = 32.8%. Widths: Search engines 100.00%, TV ads 98.48%, Social media ads 90.55%, Brand websites 78.66%.
That does not mean social wins every stage of the funnel. McKinsey’s 2025 consumer research says social media is still the least trusted source when consumers make buying decisions, even though use of social for product research has risen. The implication is clear: social ads work best when they are backed by proof, reviews, creators, and strong landing-page experiences.
Spend, pricing, and platform monetization
At the market level, 2024 was a strong year for social media advertising. Global spend climbed 15%, social placements took more than three in every ten digital ad dollars, and the U.S. market alone generated $88.8 billion in social media ad revenue. At the same time, average social CPM slipped to $5.69 in Q4 2024, showing that spend growth did not rely only on higher prices.
The largest platforms also kept improving monetization. Meta reported $164.50 billion in 2024 revenue, with full-year ad impressions up 11% and average price per ad up 10%. Pinterest grew 19% to $3.646 billion in 2024 revenue and reached 553 million monthly active users. Snap grew 16% to $5.361 billion in 2024 revenue, reached 453 million daily active users in Q4 2024, and said active advertisers more than doubled year over year in that quarter.
Label
Bar
Value
Meta revenue growth
22%
Pinterest revenue growth
19%
Snap revenue growth
16%
Global social ad spend growth
15%
U.S. internet ad revenue growth
15%
Dentsu social forecast
9.2%
Max = 22%. Widths: Meta revenue growth 100.00%, Pinterest revenue growth 86.36%, Snap revenue growth 72.73%, Global social ad spend growth 68.18%, U.S. internet ad revenue growth 68.18%, Dentsu social forecast 41.82%.
The broader structural trend still favors automated buying. DataReportal reports that dynamic distribution accounted for 82.4% of ad spend in 2024, which helps explain why improvements in targeting, inventory management, and machine-led optimization remain central to social ad performance.
Sources
DataReportal, Digital 2025 Global Overview Report
DataReportal, Global Social Media Statistics
DataReportal, Digital 2025 Global Advertising Trends
DataReportal, Digital 2025 Brand Discovery
McKinsey, State of the Consumer Trends Report 2025
IAB/PwC Internet Advertising Revenue Report: Full Year 2024
Meta, Fourth Quarter and Full Year 2024 Results
Pinterest, Fourth Quarter and Full Year 2024 Results
Snap, Fourth Quarter and Full Year 2024 Financial Results
Achieve ultimate productivity with the 10 best home office desks featuring monitor shelves that enhance comfort and organization—discover which one fits your needs!
Choose from our curated list of the 10 best soundbars to elevate your audio experience in large rooms and discover which one will transform your space.